Highcharts.js
Highcharts is a great javascript framework to build all kinds of interactive data visualizations. You can see some examples below, or visit navigateobscurity.com to see more visualisations in context.
COVID-19 map for cases, deaths, vaccinations, and movement restrictions
Full visualization in context: navigateobscurity.com/data/covid-19
Global migration flow
Full visualization in context: navigateobscurity.com/data/migration
Sigma.js
Sigma is a javascript framework that specializes in creating interactive visualisations of network graphs. It works great on its own, or in combination with other network visualisation tools like Gephi.
Guns, germs, and steel - themes visualised.
Full visualization in context: navigateobscurity.com/notes/guns-germs-and-steel
Tableau
Tableau really shines as a desktop application as it can be used for quick data explorations and visualizations. But with a small sacrifice on performance it can also be used to embed data visualizations on the web. See some examples below.
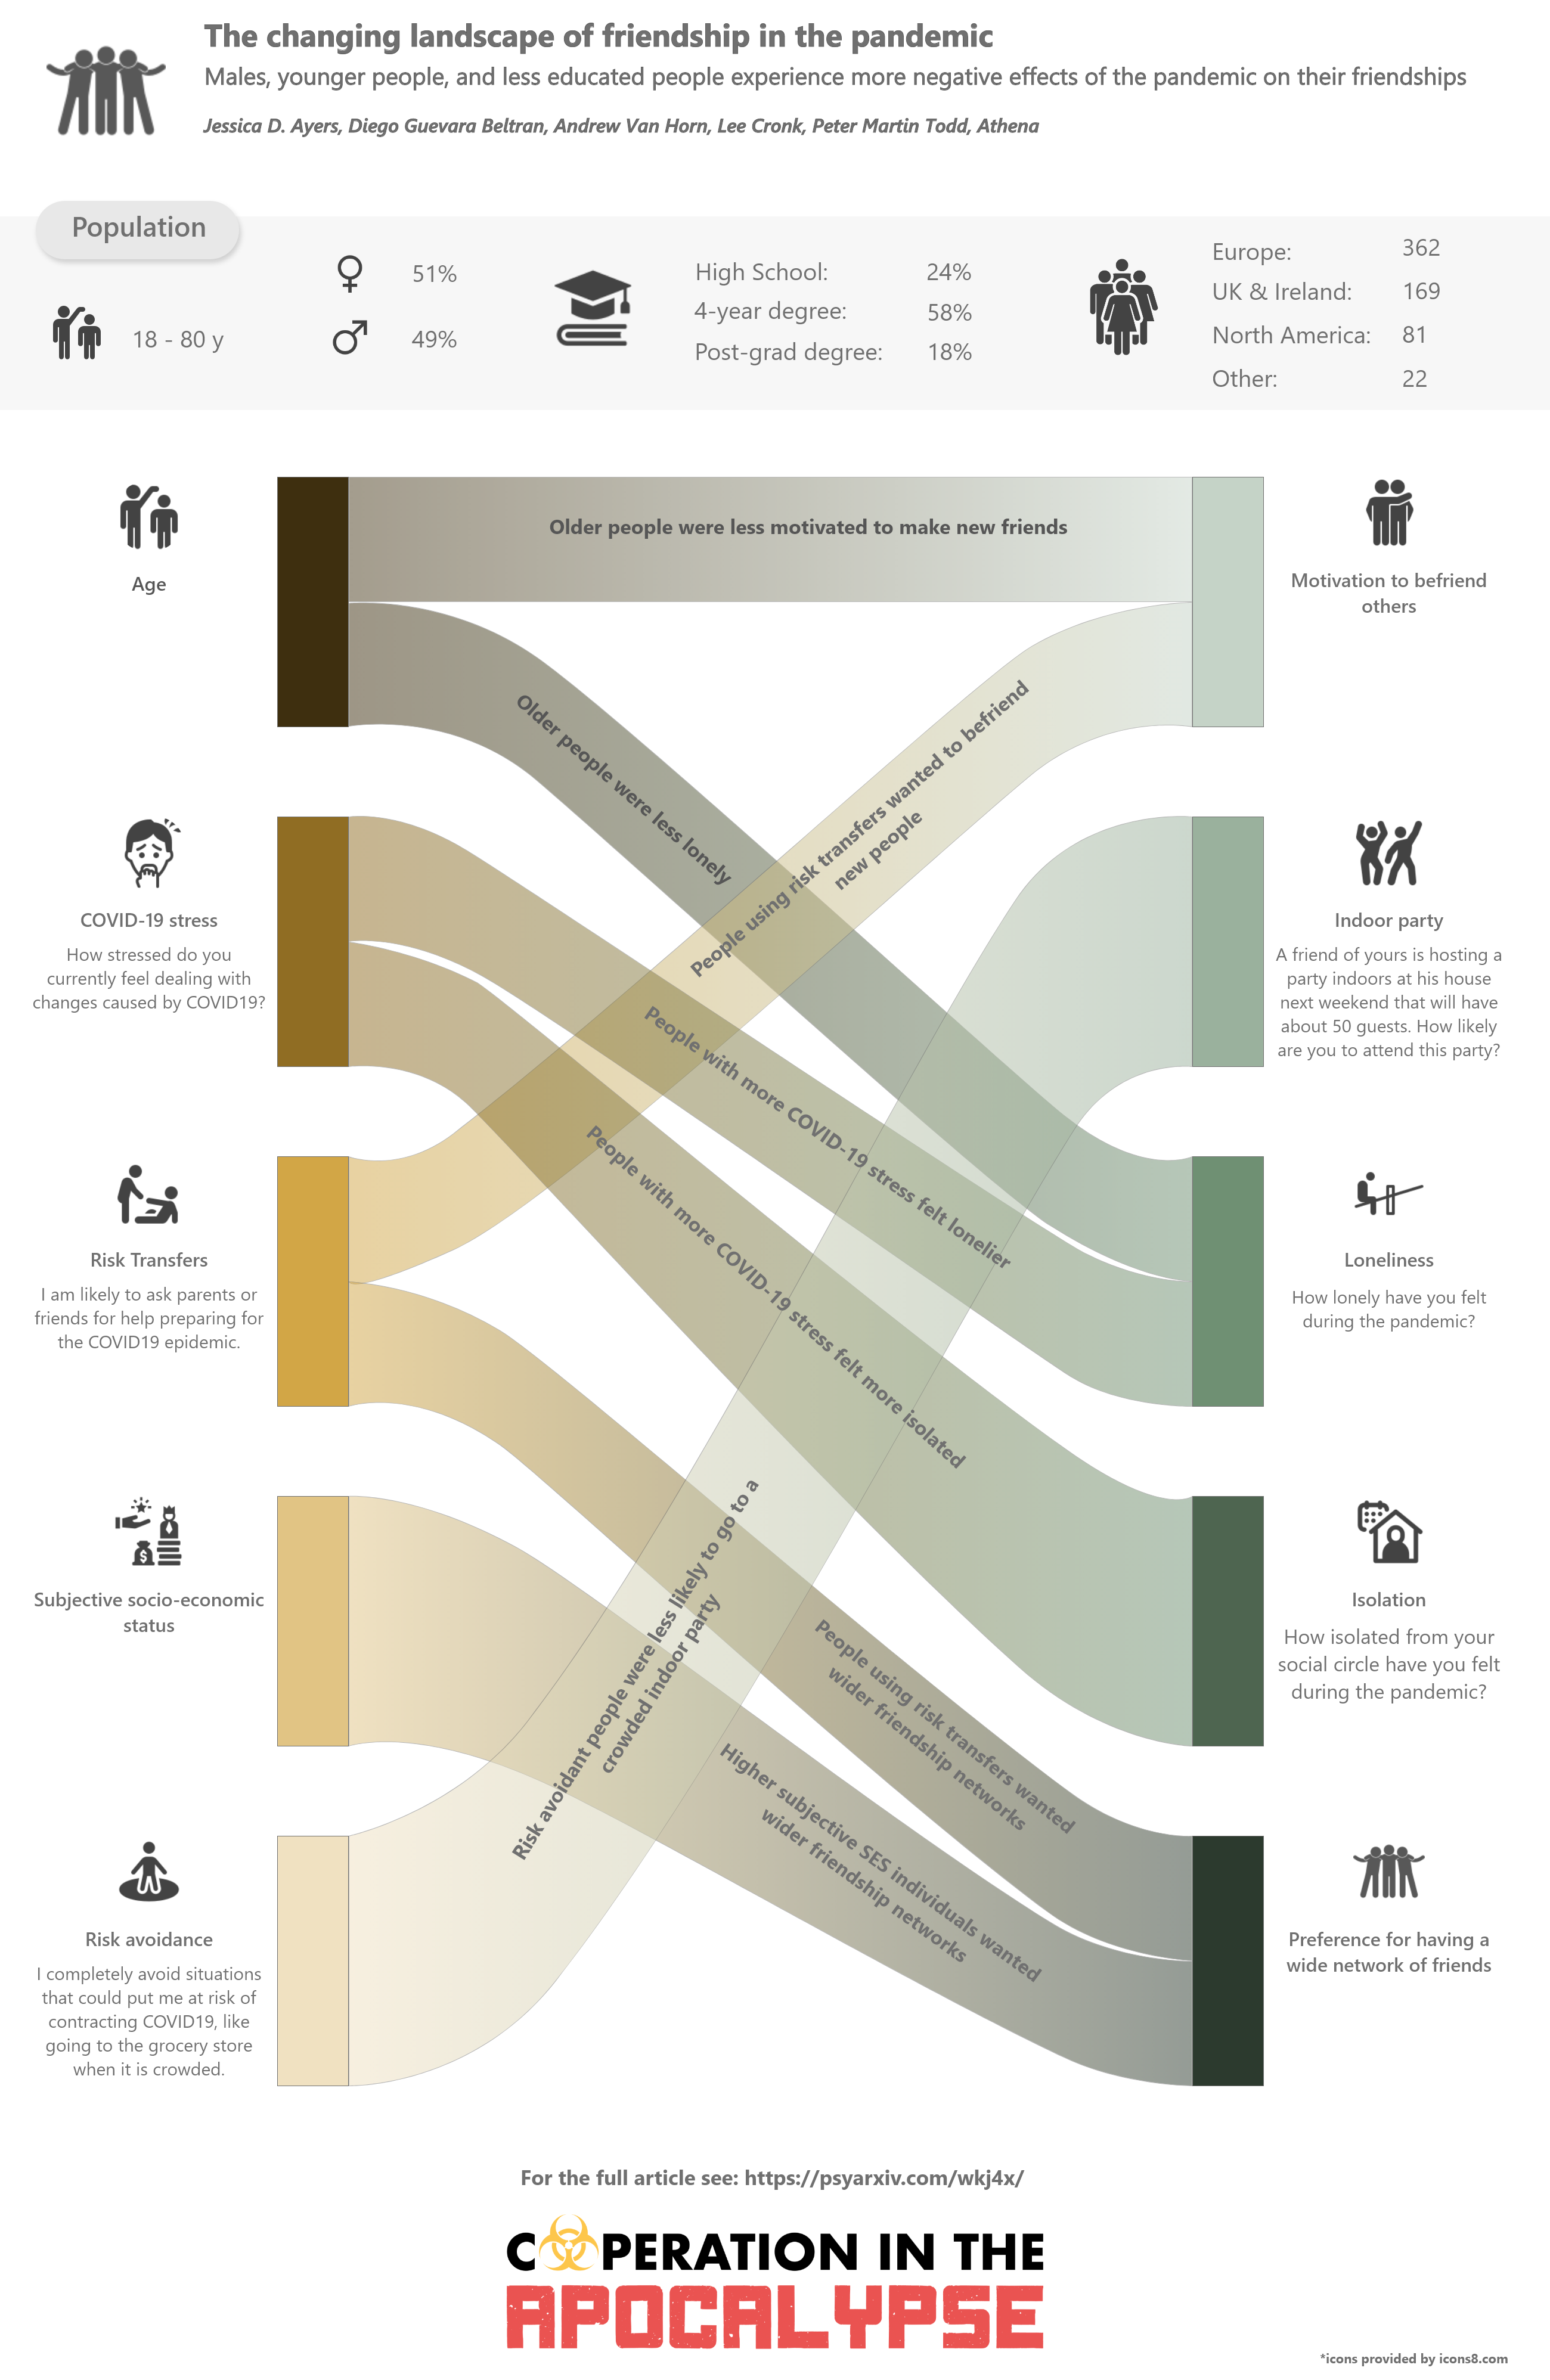
Illustrator/Photoshop
When the desired output is in a flat image format, we can combine any of the above tools with the power of photo manipulation and illustration software. See some examples below.